

Why this exists: You've built stuff. Leadership wants numbers. You're tired of "chasing shiny tools" skepticism and status reports that don't tell the real story. This toolkit helps you turn what you've delivered into language execs actually care about.
For you if: You're a Delivery Lead, Automation Team Lead, CoE Lead, or anyone who has to prove the Power Platform is paying off.
Ground truth: Everything here pulls from Microsoft's adoption guidance on measuring business value and the Business value toolkit in the CoE Starter Kit.
Time: 15–20 minutes per solution the first time. Less once you've done a few.
Ever been in a meeting where someone asks "So what are we getting from this?" and you didn't have a clean answer? Microsoft's adoption guidance breaks value into four buckets: performance improvement, cost savings, risk mitigation, and business transformation. The measures below come straight from their docs: Measure and communicate the business value of Power Platform solutions
| Category | What it means (per Microsoft guidance) | Example metrics |
|---|---|---|
| Time and cost savings | Compare time and costs before vs. after automation. Calculate based on hours saved per week or month, reduction in errors, and cost savings per task. | "4 hrs/week per user × 12 users = 48 hrs/month" |
| Error reduction | Track errors before and after implementation. Automated processes minimize errors. | "Approval errors dropped from ~15/month to 0" |
| Productivity improvements | Compare output achieved before and after implementation (tasks completed, work completed in a given time). | "Process 3× the invoices with same team" |
| Adoption / User analytics | Microsoft recommends tracking adoption rates, feature usage, and user engagement. | "85% of target users active in first 30 days" |
| Risk mitigation | Track incidents related to mitigated risks before and after; compliance rate; incident response time. | "Compliance rate improved; incident response time reduced" |

You've got stuff you can count (hours saved, errors down) and stuff that's harder to put a number on (people actually like using it, fewer headaches). Microsoft's framework says both matter. Don't leave the intangible stuff out. That's often what convinces people your solution is worth keeping.
| Tangible value | Intangible value |
|---|---|
| Revenue growth ($) | Risk mitigation and compliance |
| Reduced maintenance cost ($) | Fewer disruptions |
| Reduced paperwork and admin ($) | Improved employee experience |
| Resource optimization (%) | Improved data security |
Source: Measure and communicate the business value of Power Platform solutions
Next time someone asks "What did that automation actually do?" (or you're writing a status report or project closeout), fill this in and you're done.
Solution name:
Owner:
Live since:
| Metric | Before | After | Delta |
|---|---|---|---|
| Time per transaction | |||
| Error rate | |||
| Cycle time (end-to-end) | |||
| Hours saved per month |
One-line story for execs:
[e.g., "This automation saves Finance ~40 hours a month on purchase approvals and cut our error rate from 8% to zero."]
Evidence attached: [ ] Screenshot / [ ] Before-after process map / [ ] User count × hours saved
When you're talking to process owners, these questions tend to surface the data you need. They're from Microsoft's business value guidance:
Time and cost savings:
Productivity:
Your status update is ready when you can tick at least one of these:
Early launch? No baseline because the process was chaos before? Here's what to say instead of "we can't prove it yet."
| Situation | What to say instead |
|---|---|
| Just launched | "First 2 weeks: X active users. Full impact metrics in 60 days." |
| Qualitative wins only | "Eliminated manual handoffs; team reports less friction and fewer 'where's my stuff?' questions." |
| Pilot phase | "Pilot with [dept]. Success criteria: [list]. Decision point: [date]." |
| No baseline data | "No formal baseline. Going forward we're tracking: [list 2–3 metrics]." |
| Skeptic asking for ROI | "We're measuring [X, Y, Z]. First report in [timeframe]. Happy to walk through the methodology." |

Finance cares about different things than IT. Operations cares about different things than execs. Microsoft's guidance: adjust what you say based on who you're talking to:
| Audience | Focus on |
|---|---|
| IT | Cybersecurity, scalability, technology adoption |
| Finance | Cost savings, financial ROI, investment justification |
| Operations | Process efficiency, productivity, reduced downtime |
| Executives | How it ties to goals, KPIs, OKRs |
Source: Measure and communicate the business value of Power Platform solutions
A few apps? This toolkit is enough. Hundreds or thousands? You'll want Microsoft's built-in tools. Here's what's out there:
| Tool | What it does | Learn more |
|---|---|---|
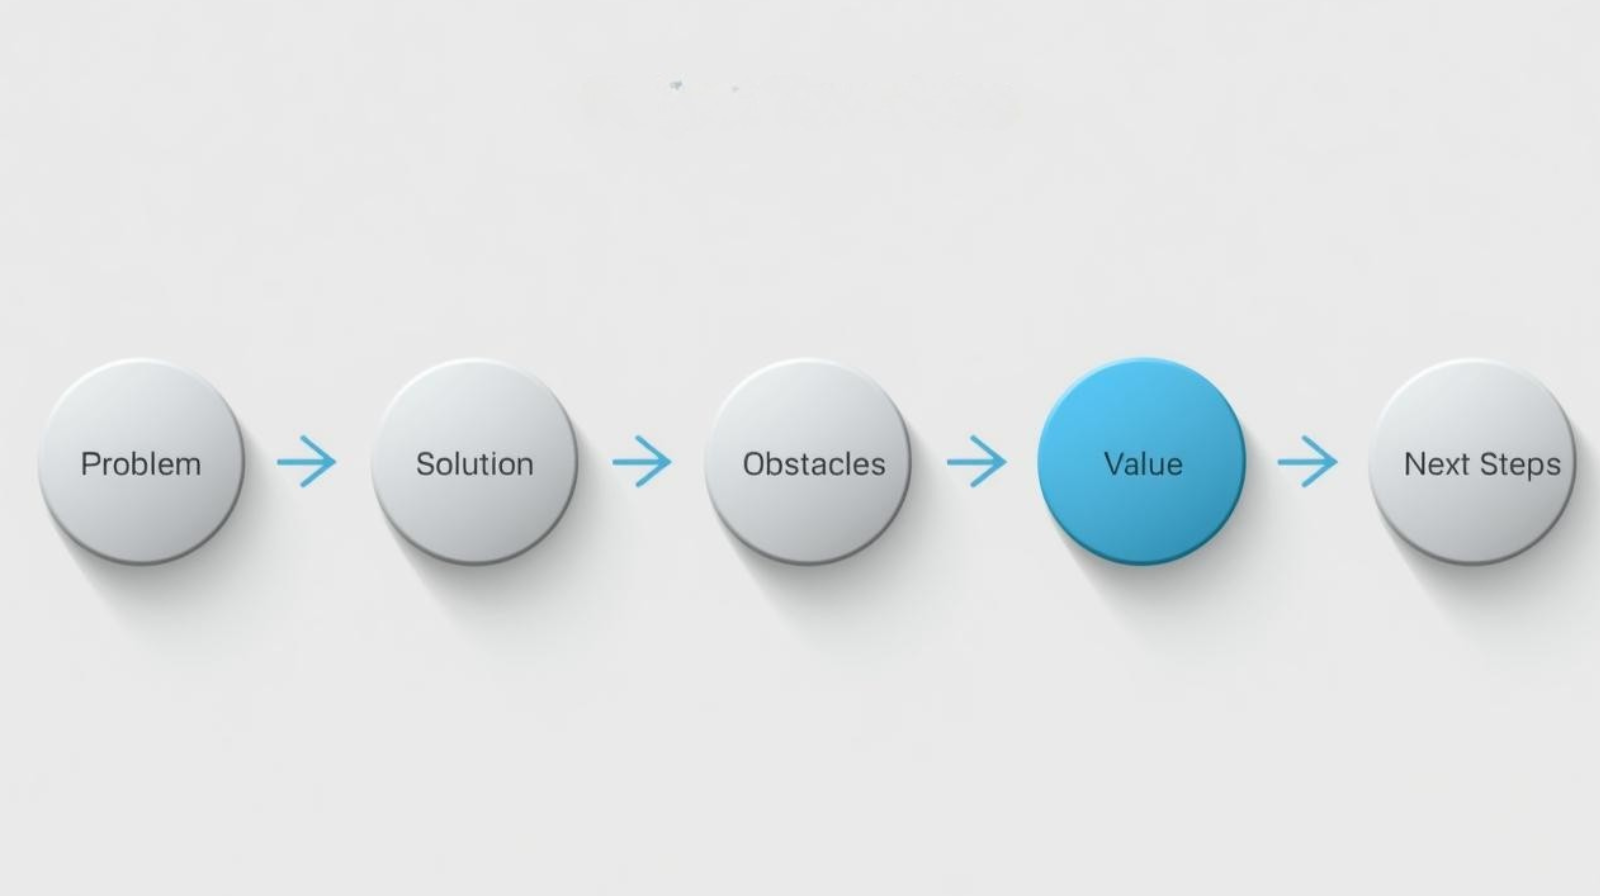
| Business value toolkit | Lives in the CoE Starter Kit. Walks app owners through a story: problem → solution → obstacles → value → next steps. Uses a value calculator so you can quantify. | Link |
| Innovation Backlog | Helps you prioritize and line solutions up with what the org actually cares about | Link |
| Automation Project app | Part of the Automation Kit for Power Automate. Tracks value across flows. | Link |
You shipped something. Here's a sentence you can paste in:
Value delivered this period: [Solution name] went live on [date]. Early metrics: [X hours saved / Y errors reduced / Z users active]. Full impact report in [next period].
I’m putting together practical things short guides, simple templates, and “here’s how we actually did it” breakdowns for teams getting serious about automation and AI. Nothing fancy. Just the kind of things that help you move from “we should do something” to “we actually did something.”
If you want early access to what I’m building next, drop your email below. No spam. Just the good stuff before it hits the blog.