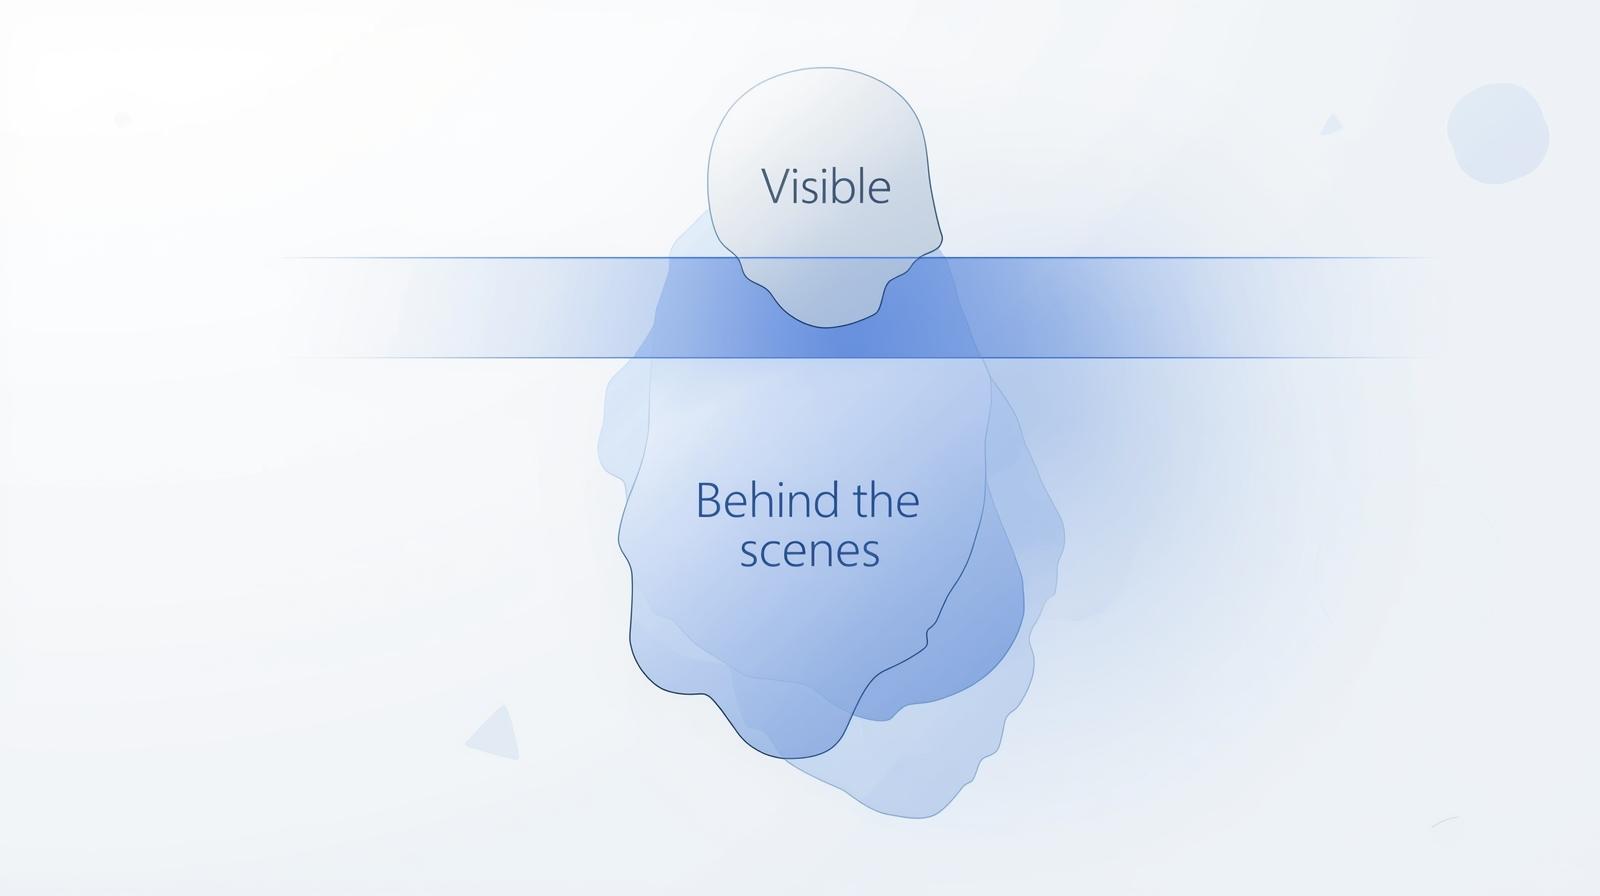


Why this exists: Your job is invisible until something breaks. Then suddenly everyone notices. This template helps you show leadership what you're doing before that happens, so they see platform health, adoption, and risk in plain terms.
For you if: You're an Admin Lead, Governance Lead, or CoE Lead responsible for the Power Platform.
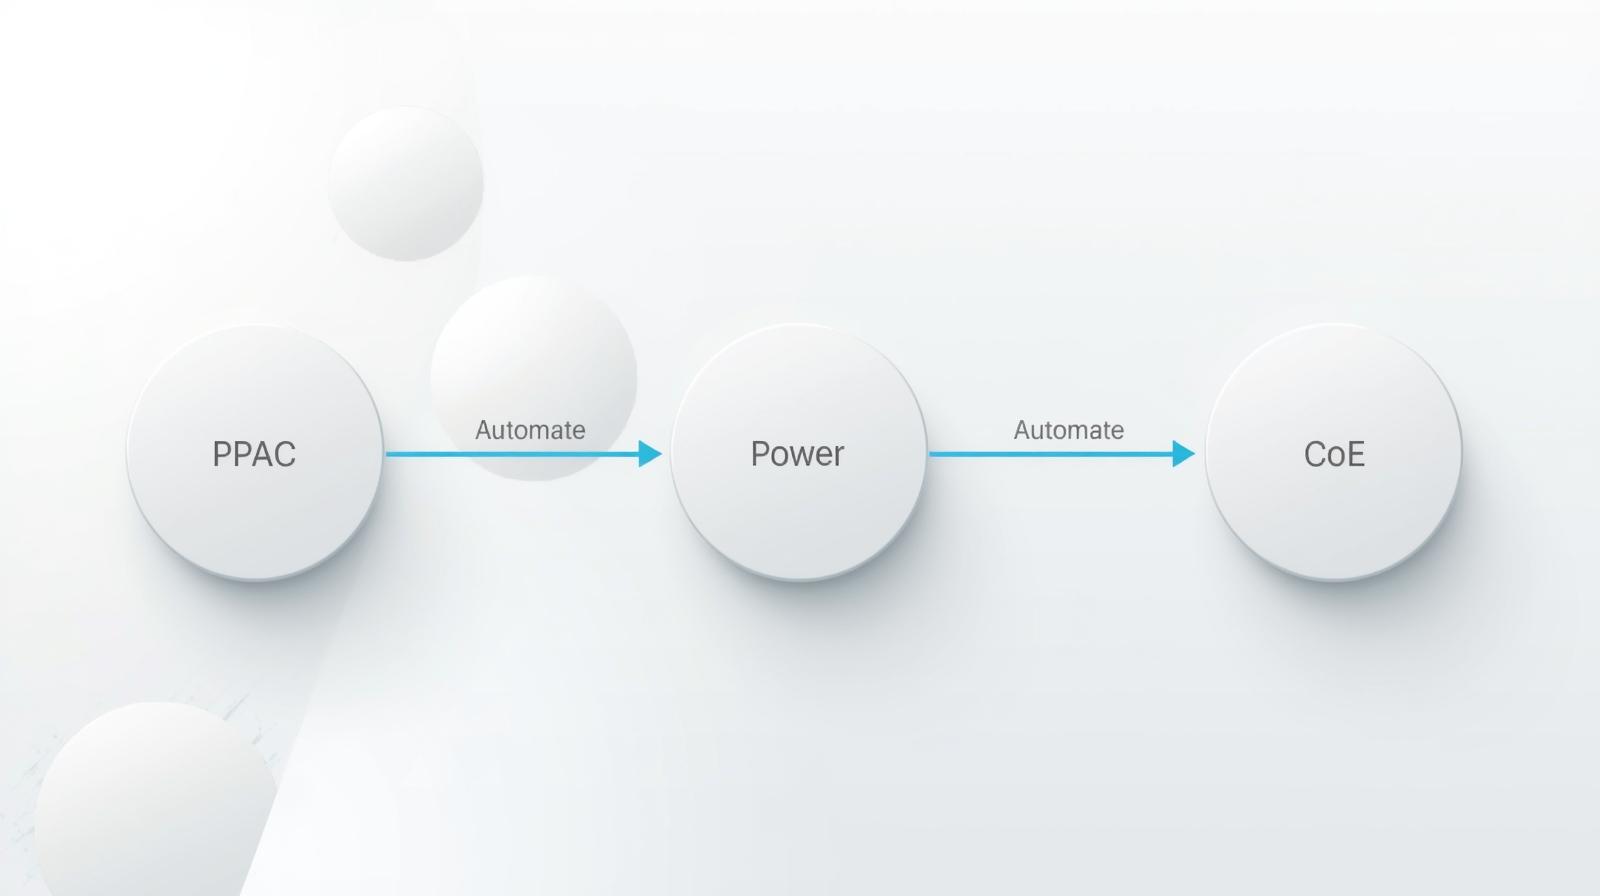
Ground truth: The metrics and data sources come from the Power Platform Admin Center (PPAC), tenant-level analytics, the CoE Starter Kit Power BI dashboard, and the Monitor area.
Cadence: Monthly or quarterly, whatever your org expects. Trim sections that don't fit.
Period: [Month YYYY]
Prepared by: [Your name]
Platform: Microsoft Power Platform
If your reader only gets this far, they should still know what's going on. Lead with the headline.

| Metric | This month | Last month | Trend |
|---|---|---|---|
| Active makers | ↑ / → / ↓ | ||
| Solutions in production (apps + flows) | |||
| New solutions this month | |||
| Top 5 connectors in use |
Where this data comes from (per Microsoft docs):
PPAC = Power Platform Admin Center. Go to Analytics → Power Automate.
| Metric | This period |
|---|---|
| Total flows (with usage in past 30 days) | |
| Successful runs | |
| Failed runs | |
| Active flows | |
| Unique makers (last 30 days) |
Source: Power Platform Admin Center → Analytics → Power Automate. Metrics from Tenant-level analytics for Power Automate.
| Metric | This period |
|---|---|
| App open success rate | |
| App session count | |
| Time to interactive (where applicable) | |
| Data request success rate |
Source: Power Platform Admin Center → Monitor → Power Apps. Requires tenant-level analytics + Managed Environment for recommendations. See Metrics and recommendations for Power Apps.
| Item | Status |
|---|---|
| Policy violations | [None / X identified and resolved] |
| DLP changes this period | [Brief summary or "None"] |
| Environment requests | [Approved / Pending / Denied, with counts] |
| Audit prep | [On track / Evidence gathered for X / Action needed] |
Example: "Connector X approved for Finance project. Temporary, 90-day review."
| Item | This period |
|---|---|
| License utilization | [e.g., "85% of allocated seats in use"] |
| Flow runs / API capacity | [Within limits / Near limit / Action needed] |
| Dataverse storage | [e.g., "62% of capacity"] |

This is the section that fixes the "they don't see what I do" problem. List the work that keeps things running. The stuff that doesn't show up as incidents.
Some examples to adapt:

Part of the Platform Governance Kit from elijah.ai. Built for Admin Leads who are tired of being invisible until something breaks. Everything here pulls from Microsoft's Power Platform admin and governance docs.

I’m putting together practical things short guides, simple templates, and “here’s how we actually did it” breakdowns for teams getting serious about automation and AI. Nothing fancy. Just the kind of things that help you move from “we should do something” to “we actually did something.”
If you want early access to what I’m building next, drop your email below. No spam. Just the good stuff before it hits the blog.