
Let me talk about Microsoft Power BI. It’s a business analytics tool that helps organizations visualize data, share insights, and make informed decisions. But that description doesn’t really capture what it can do for you.
I’ve seen organizations transform how they understand their business using Power BI. They move from spreadsheets and gut feelings to data-driven insights. They spot trends before they become problems. They make decisions faster because the information is right there, visualized in ways that make sense.
Let me explain what Power BI is, what you can do with it, and why it matters for your organization.
What is Microsoft Power BI?
Microsoft Power BI is a collection of software services, apps, and connectors that work together to turn your data into insights. That’s the official description, but here’s what it really means:
You have data everywhere. In spreadsheets, databases, cloud services, and applications. Power BI connects to all of it, brings it together, and helps you see what it means. Instead of staring at rows and columns of numbers, you get visualizations that tell a story.
Think of it like this: If Excel is your calculator, Power BI is your data storyteller. It takes the numbers and shows you what they mean.
What Can You Do With Power BI?
Here are the main ways organizations use Power BI:
Create visualizations. Turn your data into charts, graphs, maps, and other visual formats. A bar chart showing sales by region is easier to understand than a spreadsheet with the same data. Power BI makes it easy to create these visuals.
Build dashboards. Combine multiple visualizations into a single view. A sales manager might have a dashboard showing revenue, pipeline, and team performance all in one place. They can see the big picture at a glance.
Generate reports. Create detailed reports that can be shared with stakeholders. These reports can be interactive, letting people drill down into the data to explore what interests them.
Share insights. Publish dashboards and reports so others in your organization can access them. You can control who sees what, ensuring people have access to the data they need without exposing sensitive information.
Access from anywhere. Power BI works on desktop computers, tablets, and phones. Your data insights travel with you.
Why Power BI Matters
Here’s what makes Power BI valuable for organizations:
It makes data accessible. You don’t need to be a data scientist to understand what your data is telling you. Power BI’s visualizations make patterns obvious. Trends become clear. Problems stand out.
It saves time. Instead of spending hours pulling data from different sources and trying to make sense of it in Excel, Power BI automates the process. Connect to your data sources once, and Power BI keeps the information updated.
It enables better decisions. When you can see what’s happening in your business clearly, you can make informed decisions faster. You’re not guessing. You’re using data.
It scales. Power BI works for small teams and large enterprises. You can start with a simple dashboard and grow into complex analytics as your needs evolve.
The Different Versions of Power BI
Power BI comes in a few different flavors, depending on your needs:
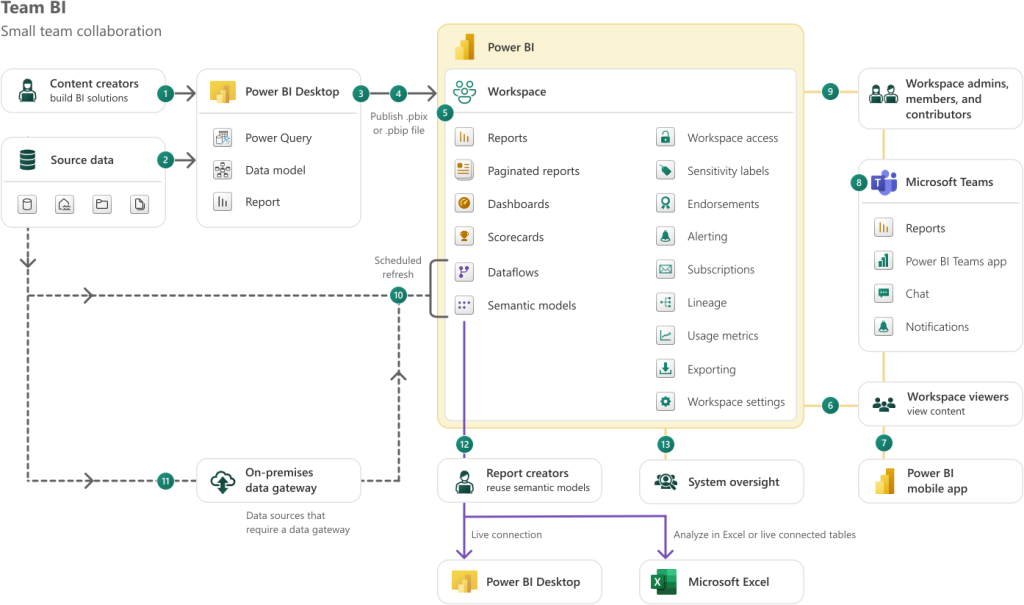
Power BI Desktop is a free application you install on your computer. It’s great for creating reports and dashboards. You can connect to data sources, build visualizations, and design reports. It’s perfect for getting started or for individual analysts.
Power BI Service is the cloud-based version. This is where you publish reports and dashboards so others can access them. It includes collaboration features, automatic data refresh, and mobile access. This is what most organizations use for sharing insights across teams.
Power BI Mobile apps let you access your dashboards and reports from phones and tablets. You can check your data anywhere, anytime. The mobile apps are optimized for touch and make it easy to interact with your data on the go.
Power BI Embedded lets you integrate Power BI reports into your own applications. If you’re building a custom application and want to include analytics, you can embed Power BI reports directly into it.
Key Features Explained Simply
Let me break down some important features in plain English:
Data Connectivity means Power BI can connect to hundreds of data sources. Excel files, SQL databases, cloud services like Salesforce or Google Analytics, and many others. You’re not limited to one type of data source.
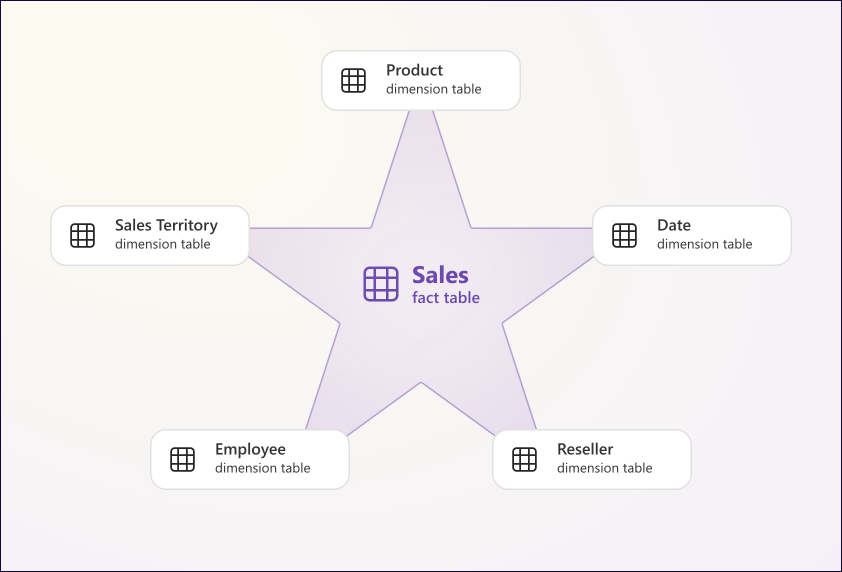
Data Modeling lets you create relationships between different data sources. If you have customer data in one place and sales data in another, Power BI helps you connect them so you can analyze them together.
DAX (Data Analysis Expressions) is the formula language Power BI uses. It’s similar to Excel formulas but more powerful. You can create calculated columns and measures that perform complex calculations. Don’t worry if you’re not familiar with it. Power BI has a formula bar that helps you write DAX formulas, and many common calculations are built in.
Visualizations are the charts, graphs, and other ways Power BI displays your data. There are dozens of built-in visualization types, from simple bar charts to complex maps and custom visuals. You can also create custom visuals if you need something specific.
Natural Language Q&A lets you ask questions about your data in plain English. Type “What were our sales last month?” and Power BI will create a visualization showing the answer. It’s like having a conversation with your data.
AI Insights use artificial intelligence to automatically find patterns and insights in your data. Power BI can detect anomalies, identify trends, and suggest visualizations based on what it finds in your data.
How Organizations Use Power BI
Here are some real-world examples of how Power BI helps organizations:
Sales teams track revenue, pipeline, and performance metrics. They can see which products are selling, which regions are performing well, and which sales reps need support. Dashboards update automatically, so the information is always current.
Operations teams monitor key performance indicators (KPIs) in real-time. They can track production metrics, supply chain status, and operational efficiency. When something goes wrong, they see it immediately.
Finance teams analyze financial performance, track budgets, and forecast future results. They can drill down from high-level financial summaries to detailed transaction data.
Marketing teams measure campaign performance, track customer acquisition costs, and analyze customer behavior. They can see which marketing channels are most effective and optimize their spending.
Executive leadership gets high-level dashboards showing organizational health. They can see revenue, costs, customer satisfaction, and other key metrics at a glance. When they need details, they can drill down.
Getting Started With Power BI
If you’re thinking about using Power BI, here’s how to get started:
Start with Power BI Desktop. It’s free, and you can download it right now. Connect it to a data source you’re familiar with, like an Excel file. Build a simple visualization. Get comfortable with the basics.
Identify a specific use case. Don’t try to build everything at once. Pick one report or dashboard that would be valuable. Maybe it’s a sales dashboard. Or an operations report. Build that first.
Learn the fundamentals. Microsoft provides extensive documentation and training resources. You don’t need to become an expert overnight, but understanding how Power BI works will help you build better reports.
Think about your data. Where does your data live? Is it clean and organized? Power BI works best when your data is well-structured. You might need to clean up your data sources before connecting them.
Consider governance. As you scale Power BI across your organization, think about who can create reports, who can share dashboards, and how you’ll manage data access. Power BI has built-in security features, but you need to configure them properly.
Common Challenges and Solutions
Here are some challenges people face with Power BI and how to address them:
Data quality issues. If your source data is messy or inconsistent, your Power BI reports will reflect that. Solution: Clean your data at the source, or use Power BI’s data transformation features to clean it as you import it.
Performance problems. Large datasets can make reports slow to load. Solution: Use data modeling best practices, create aggregated tables for large datasets, and consider using Power BI Premium for better performance.
Too many reports. Organizations sometimes create so many reports that people can’t find what they need. Solution: Organize reports into workspaces, use consistent naming conventions, and regularly review and archive unused reports.
Security concerns. Sharing data across an organization requires careful security management. Solution: Use Power BI’s built-in security features, implement row-level security to restrict data access, and establish clear governance policies.
The Bottom Line
Microsoft Power BI is a powerful tool for turning data into insights. It makes data accessible to more people, saves time, and enables better decision-making.
But here’s the thing: Power BI is just a tool. The real value comes from using it to solve real business problems. It’s not about creating beautiful dashboards. It’s about helping people make better decisions with data.
When organizations embrace Power BI, they move from reactive decision-making to proactive insights. They spot trends before they become problems. They make decisions based on data, not assumptions.
The question isn’t whether Power BI is powerful enough. It is. The question is: What question do you want your data to answer?
Start there. Build one report that answers that question. Then build another. Before you know it, you’ll have transformed how your organization uses data.

Excellent breakdown of the topic. Really appreciate the detail!